Creating US map using Zip Codes
Using zip codes, we can easily obtain any projection of a US map. The zip codes can then be grouped at any level, such as county, state, or an unique region. The best use case for zip code grouping is that it allows us to create our own regions by grouping the zip codes that we wish to be in that region. Finally, we can create a map that shows the level at which we classified the zip codes.
Vitara Zip code grouping tool
Based on a data file containing grouping information, the Zip Code grouping tool blends separate zip codes into regions/states to generate a single region.
To access the tool, follow this link:
VitaraMaps - Tool for grouping zip codes
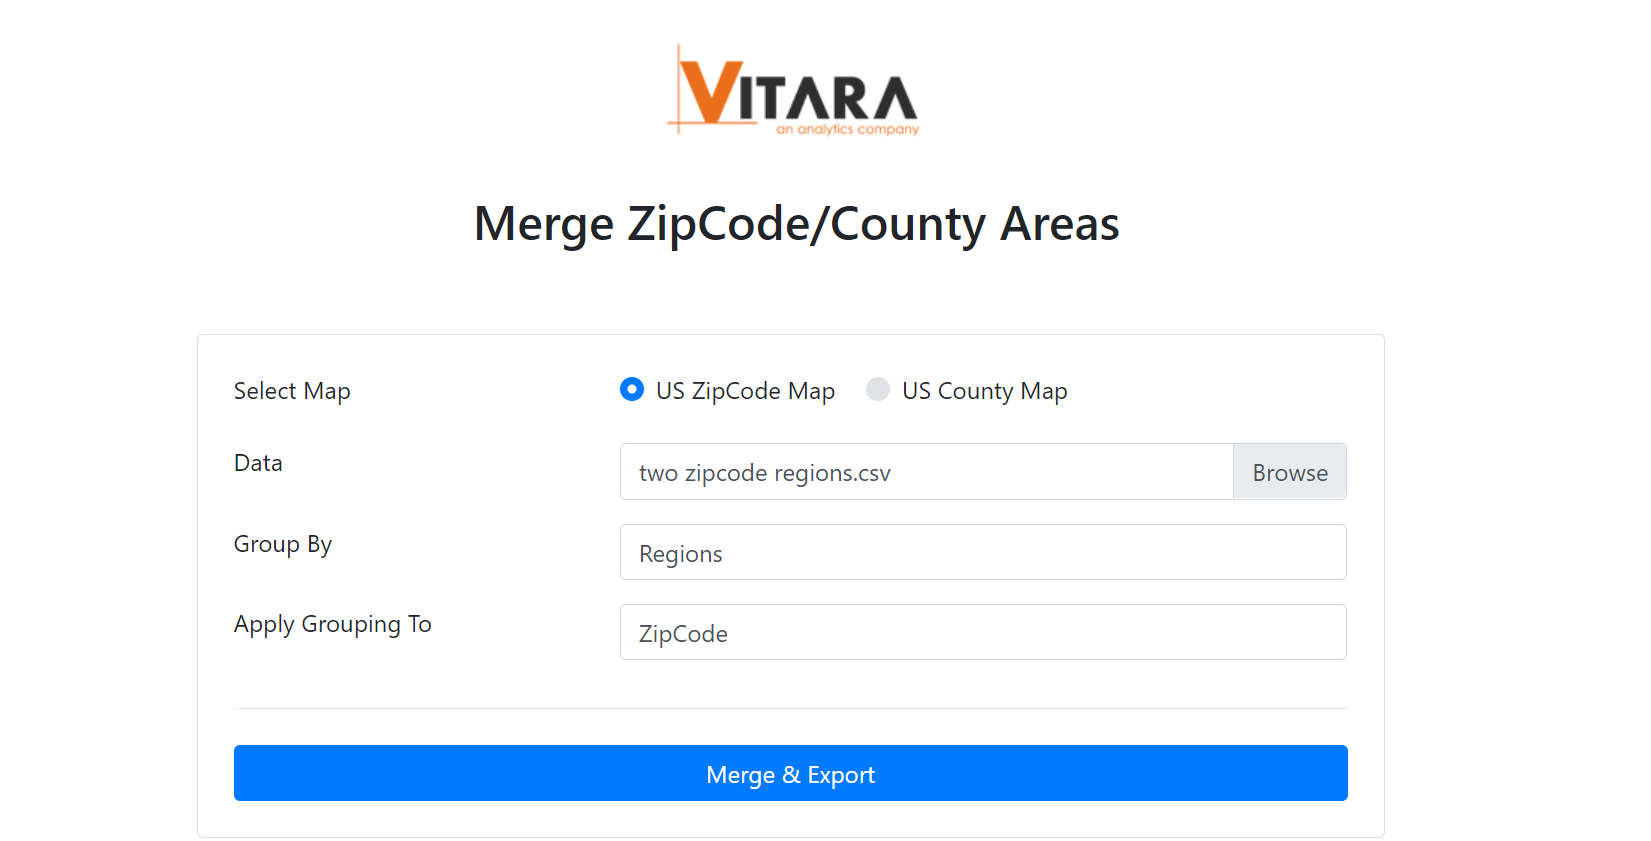
The below screenshot is from vitara zip code grouping tool web page.

Example of zip code aggregation:
Consider that there are ten zip codes. Now I want to create a US map chart with all of these zip codes divided into two regions and data at the region level. It is possible to create a map that depicts regions by grouping these zip codes into relevant regions. The table below contains ten zip codes and their related regions.
| Zip Code | Region |
|---|---|
| 29105 | 1 |
| 29137 | 1 |
| 29164 | 1 |
| 29801 | 1 |
| 29802 | 1 |
| 29803 | 2 |
| 29804 | 2 |
| 29805 | 2 |
| 29808 | 2 |
| 29809 | 2 |
I need a shape file (.json) of these regions in order to make a map that depicts them. The methods below demonstrate how to create a shape file using zip codes.
Step 1:
Access the Vitara zip code grouping tool using the link mentioned below. The zip codes file should be a csv file. VitaraMaps - Tool for grouping zip codes
Step 2:
Upload the csv file by clicking “Choose File” option.
Step 3:
In our example, we want to group zip code at region level, fill the “Group By” field with the column name “Region”.
Step 4:
We want to group zip codes, fill the “Apply Grouping To” field with column name “ZipCode”.
Step 5:
Click “Merge & Export” and json file will be downloaded.

The next steps will be the same as we covered while demonstrating how to create a the world continents map. The screenshot below is of a Vitara map chart made from zip codes in the United States, sorted by state.
