Properties Menu - Column Total
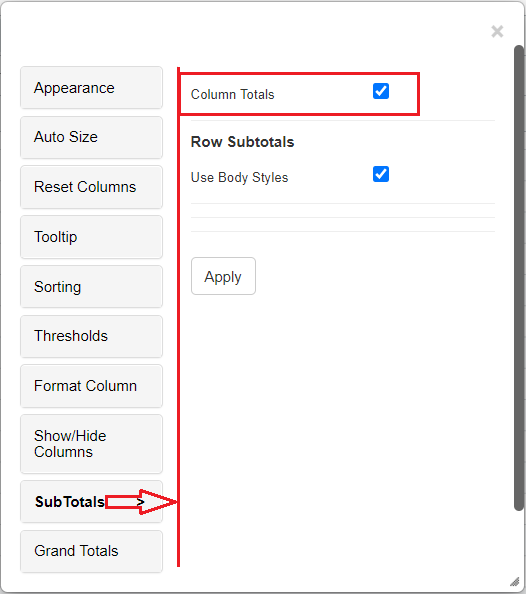
From the 4.5 version of Vitara charts, column totals feature is implemented in the Grid chart. By default, the column total is not shown. We have to enable the Column Totals in the ‘SubTotals’ property in the property editor.
The only default aggregation for Column Totals is “Sum” of the metrics in the chart.
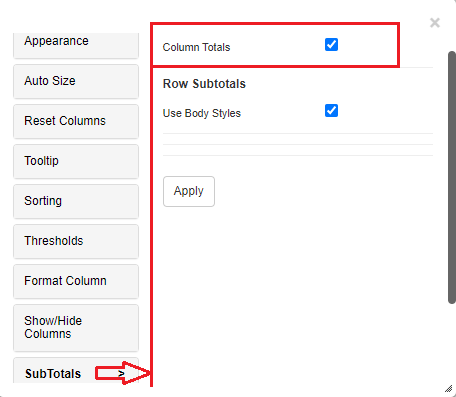
Below is the screenshot where the column totals are in enabled state in the property editor.
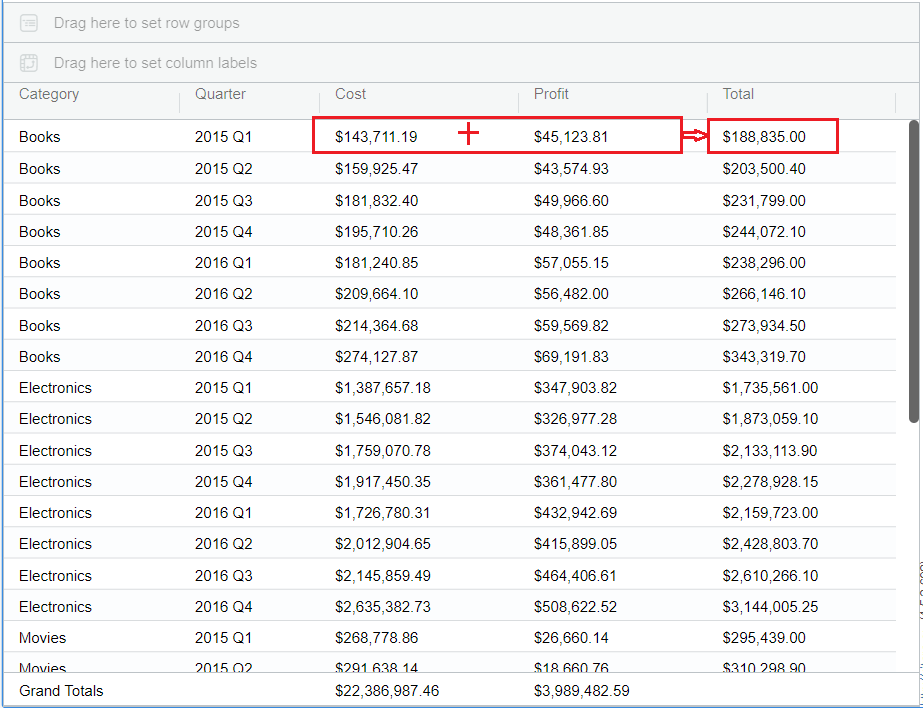
Below is the screenshot where the Column totals is enabled and ‘Total’ column is displaying in the chart calculationg the metrics in the chart.
Column totals when Grouping is enabled
Group any attirbute in the chart, and enable the column totals in the property editor. The totals column can be added where the totals are calculated acorss the metrics.
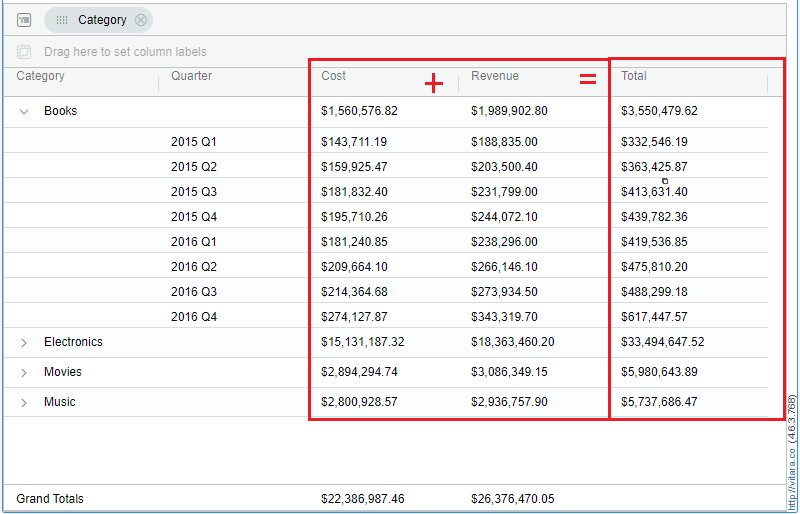
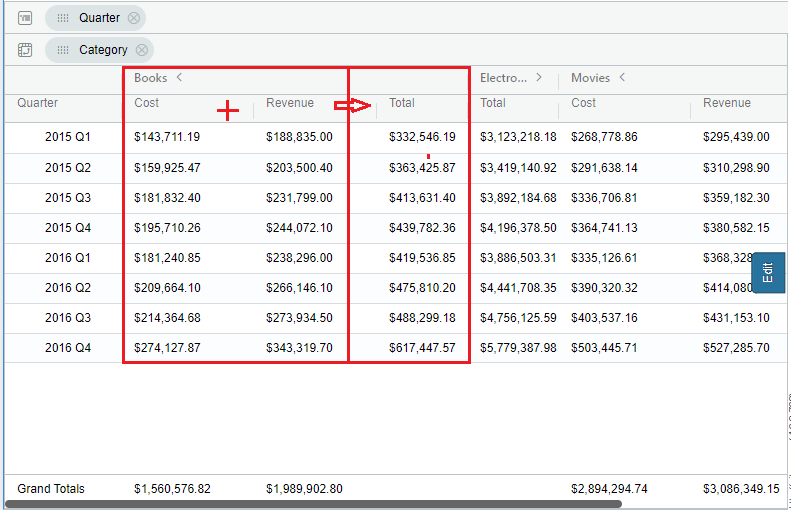
Below is the screenshot where the grouping is applied on Category attribute and ‘Total’ column is calculating across the metrics ‘Cost’ and ‘Revenue’.
Column Totals with Pivot
To get totals across the metrics in the chart.
Pivot any attribute in the chart and the other attributes automatically gets grouped in the char. Enable the Column Totals in the Sub totals property. Now you can see the ‘Total’ column calculated across the metrics.
Below is the screenshot where Category attribute is pivoted and Total is calculated across the Cost and Profit metrics.
To get totals on a single metric next to the attribute.
Assume two attributes and two metrics are added to the Vitara Grid chart. Apply ‘Move to Rows’ on any metric in the chart, then Pivot the ‘Metrics’ column along with a attribute and the other attribute will be automatically grouped. Make sure the ‘Metrics’ column should be in the first position of the Pivot zone.
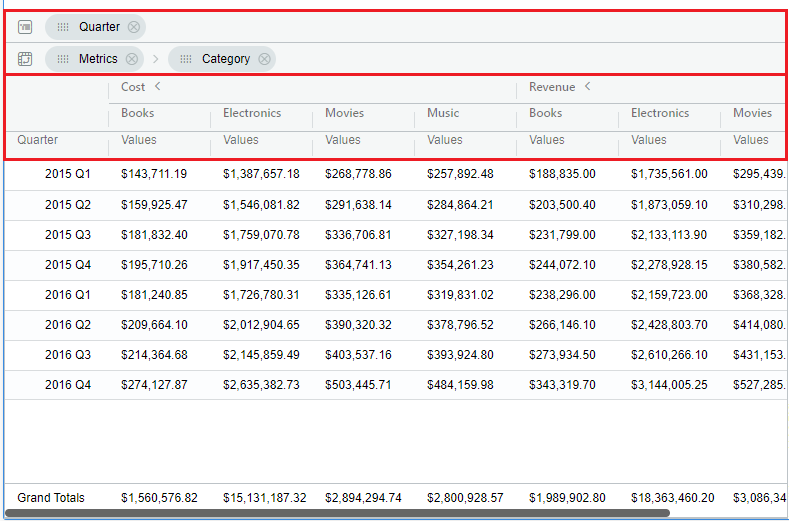
Below is the screenshot where the Category, Quarter are the two attributes and Cost, Revenue are the two metrics added to the chart. The ‘Mover to rows’ is applied on a metric in the chart and the ‘Metrics’ column is pivoted along with the ‘Category’ attribute.
Enable the Column Totals in the Sub totals property. Now you can get the Totals on a single attribute next to the attribute in the chart.
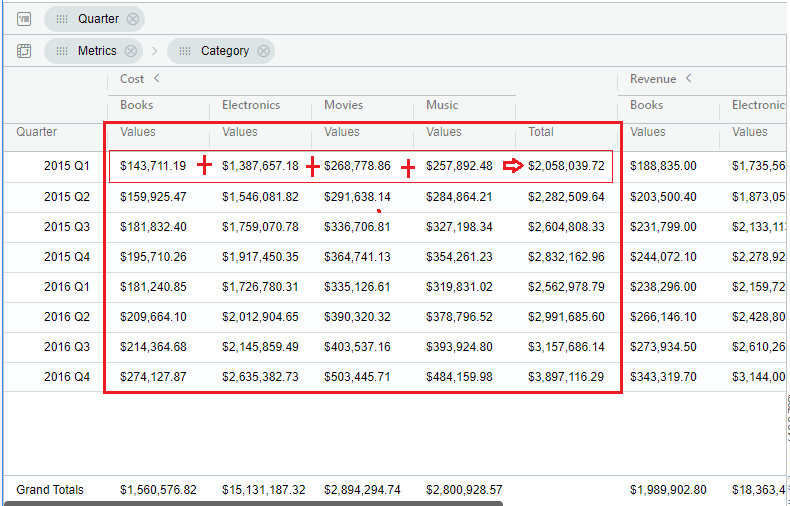
Below is the screenshot shown where Total column is shown when ‘Metrics’ column and Category attribute are pivoted and Quarter attribute is grouped. Now you can see the totals on the ‘Cost’ metric next to the Quarter attribute.
Starting from version 5.2.8, the Column Totals option will only be used to display total columns in non-pivoted charts. When using a pivot, this option will be hidden. In version 5.2.8, two new options have been added to the Subtotal tab: Pivot Row Total and Pivot Group Total.Click here to learn more.
